In addition to sorting records in a database or querying records that meet specific conditions, most database applications allow users to create reports. A report can contain explanatory headings, grouped records, and summary data. Reports can also be combined with queries. For example, you might create a report to explain the salaries of senior employees. But, you might combine this report with queries that select employees by different age ranges.
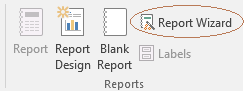
To define a report, click on the Create tab at the top of the screen, then look for the Reports section, Now click on Create Report by using wizard.
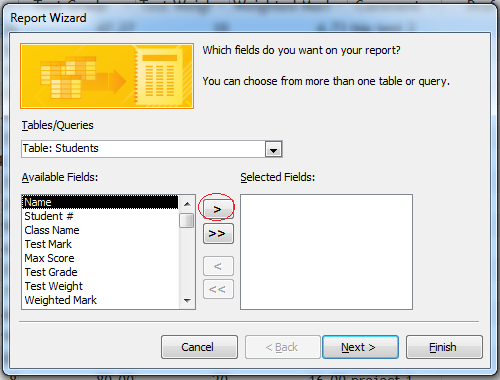
This window allows you to select the fields you want in your report. In the first dropdown menu, you can choose where the fields for your report will be obtained. In this example, the fields will be from the students table.
Under the Available Fields, you get to choose the fields you want. Highlight the field and click on the > to bring it to the Selected Fields window.
Transfer the following fields to the selected fields window: Student #, Test Mark, Test Grade, Test Weight, and Weighted Mark. You should have created these fields when you created your table. If you haven't created these fields do so now then come back. Once the above fields have been selected, click on Next.
Note: If you make a mistake and transfer the wrong field over then all you need to do is highlight the field that you accidentally sent over and then click on the < button; also if you want to send all fields over to the report press the >> button.
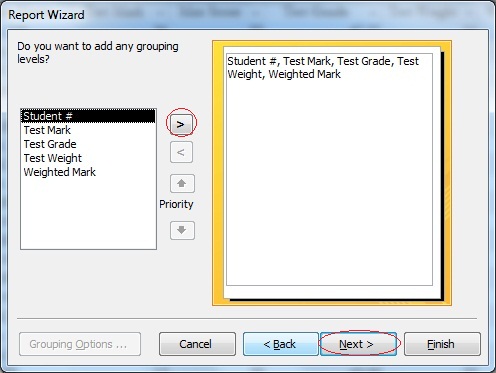
Another window appears which will let you create groupings of the selected fields.
Say you want a report to show each student's test marks, test grade, test weight, and weighted mark by the student's student #, then Student # will have the highest priority. Notice that if you select a field for grouping it becomes automatically sorted.
Highlight Student # and click on >. Click on Next when you are done.
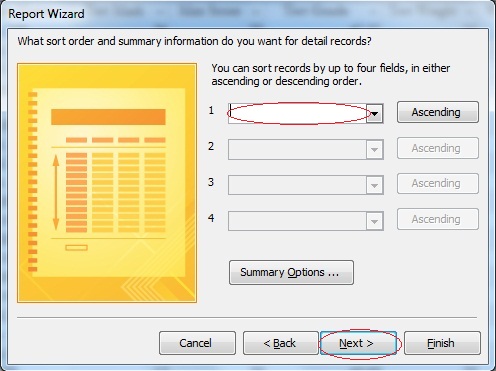
This window allows you to sort your report. You can sort by more than just one field.
Click on the first drop down menu and select Test Mark. Now Test Mark is used for sorting the report. If you want to sort by another field, click on the second drop down menu and select the field you want to be sorted next. The field in the first drop down menu has a higher priority over the second drop down menu. Priority meaning that your report will be sorted first by field selected in the first box, second by the second box, and so on.
Click on Next.
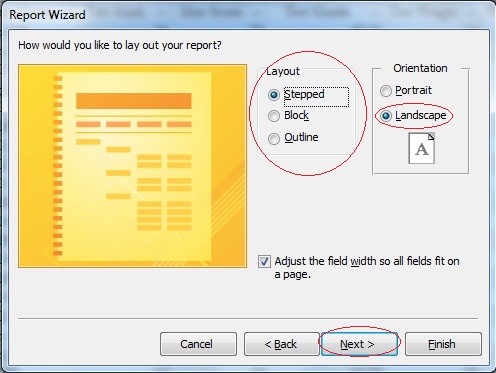
Now, at the next window, select the layout of your report. Select the layout you want for your report and click on Next. Note for your assignment it is recomended that you use the orientation Landscape.
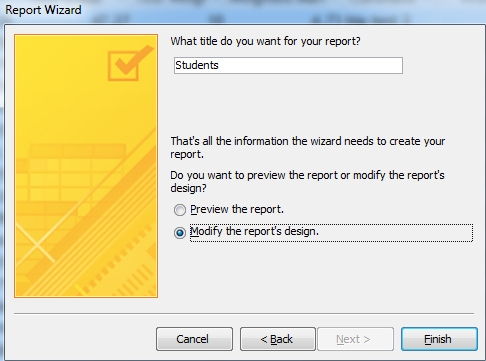
Finally, in the last window, give a name to your report. Then select the Modify the report's design option. After typing in a new title and selecting the modify option, click on Finish.
Create a new report from Query 1, containing the fields: Name, Student Number, and Class Name.
The purpose of this report is to show who is in what class. Group the report by Class Name.
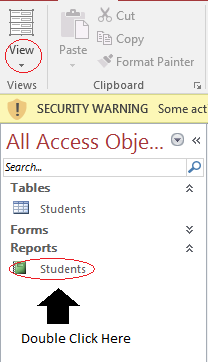
To edit your report, double click on your report in the object list, then click on the arrow in the view section of the menu bar
at the top of the screen. Then click on the design view icon  in the
drop down menu.
in the
drop down menu.
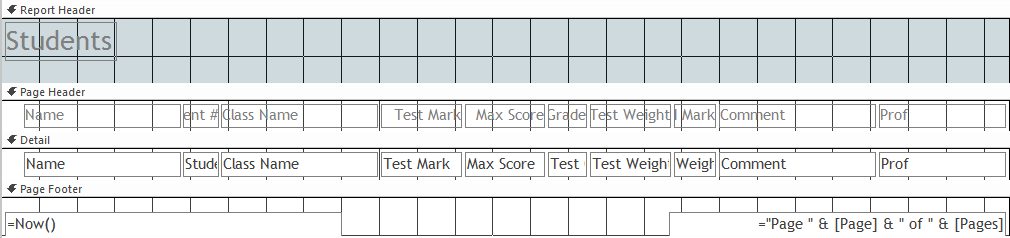
The text boxes in the header segments of your report and the text boxes in black are the actual data from your database. You can click and drag the text boxes to different locations and change the style of the text by clicking on the text box. To insert more fields into your report, go to the Tools menu and select Add Existing Fields. Now click on the field name and drag it onto the report grid. To separate labels from text boxes, right click on the text box and choose Layout > Tabular.
Edit your report, by adding new labels.
Groups must be created within the Report Wizard. Follow the steps listed above in Defining a report . When you reach the step that asks if you want to set grouping priority select a field in which you want to group your records. Notice that the chosen field becomes bolded and in blue in the preview window. Click Next to proceed.

You will then be asked to sort or summarize your data. Choose a field and select whether to sort it Ascending or Descending. Then click on the Summary Options button.
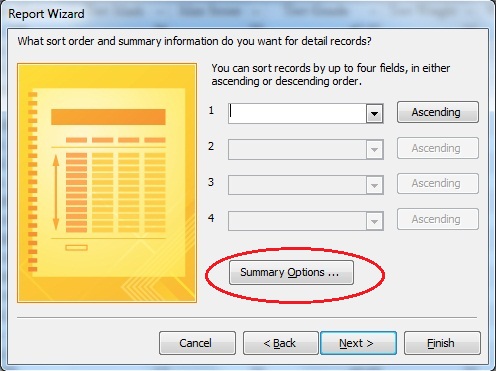
It should look like this once you have clicked the button
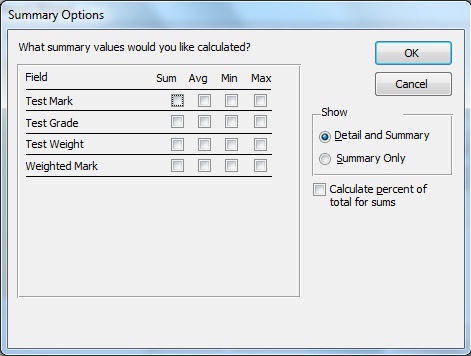
These summary options allow you to calculate averages and calculate sums of only numerical fields. To create a Count summary you must create a Group Summary which is outlined in the next section.
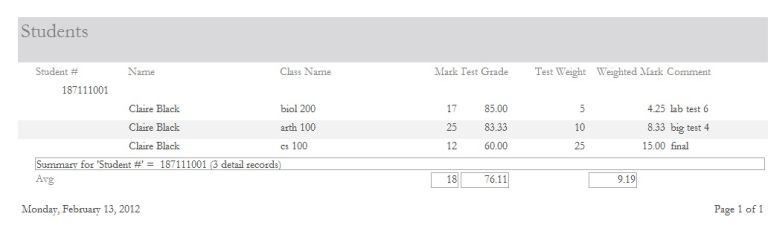
Complete the Report Wizard. Your report will now be grouped and should look something like this:
Create a report that includes grouping and summary statistics.
Group summaries are used to give subtotals or statistics for a certain group of data within a report.
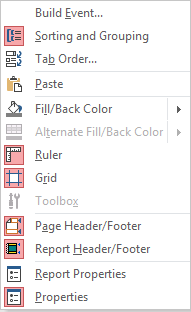
Begin by opening up your report in design view. Then Right Click anywhere on the report grid; try to avoid clicking on fields or labels. You will open the following menu. Click on Sorting and Grouping.
The following window will open at the bottom of the page. If you click on the More button you will notice all the options. You can create more groups, by adding more sorting fields. To add group summaries we must add a group footer. You can do that by selecting which field you wish to display group statistics for and then change the group footer option to with a footer section. Note that if you have made a field a group, Group Header is set to "with a header section" and Group Footer is set to "with a footer section".

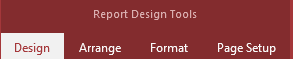
You will now have a new section, footer section, in your report. Now we have to add text boxes to the footer section to create group summaries. To add text boxes, open up the Report Design Tools. This is a series of four tabs side by side at the top of the screen. The one you will whant to click is the "Design" tab.
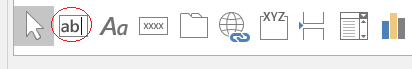
Then create a text box, by clicking on the text box icon. Within the report grid, click, hold, and drag out a new text box.
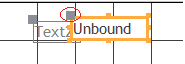
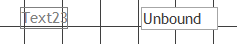
You will notice that the label seems to be underneath the field. To fix this click on the large gray square on the top left hand corner of the label. Then drag the label to an appealling position. You will end up with something like this:
Now click on the text box and then look to the right side of the screen to see the properties sheet. If the sheet is not there then right click on the text box and select properties from the menu; it's at the bottom.
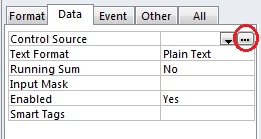
If you are not already in the Data tab, click on it now. Within the Data tab, click on the three dots at the end of Control Source
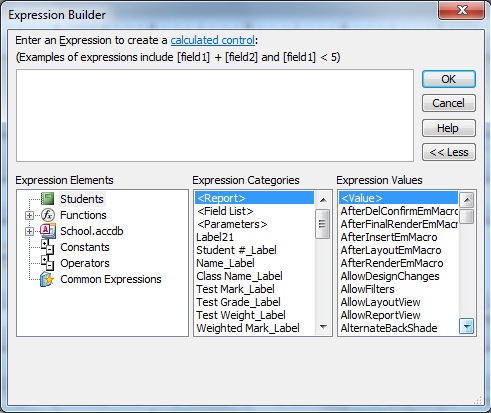
The expression builder will open up. You can create expressions just like you did in Queries. But, to create summary statisics we will use these formulas: =Avg([table name]![field name]), =Sum([table name]![field name]), =Count([table name]![field name]).
To add the formula into the expression builder type: =count(
Then in the bottom windows, either in the Tables or Queries folder select the field you want to find the count
of. You can also add formulas for avg, sum, etc.
Note: The formulas are not case sensitive, so you can use lower case letters (Ex: avg) or upper case (Ex: Avg).
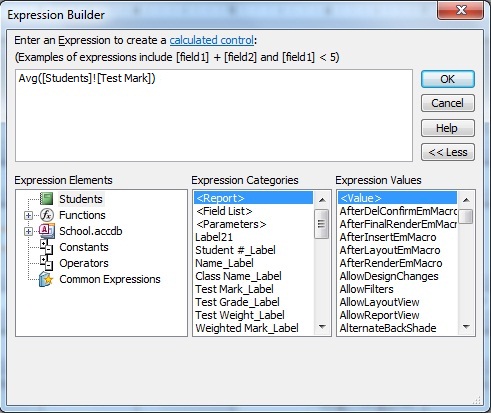
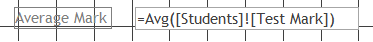
When you're done just click OK. You should end up with something like this:
To add summary statistics to the end of the report, open up the report footer section and then follow the same steps as you would to add a group statistic in design view.
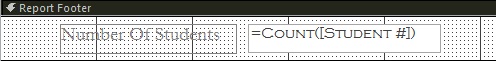
You should get something like this:
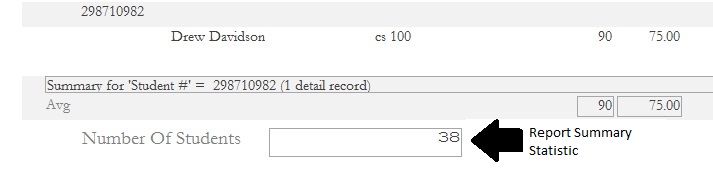
To view your finished report, exit design mode by closing the design window. Now, double click on the report you wish to view.
Find the average Test Mark and the count of Class Name for each student number.
Find the count of every student number found in Query 1, use Report Summary Statistics