A Brief Introduction to Xcode 4 Workspace
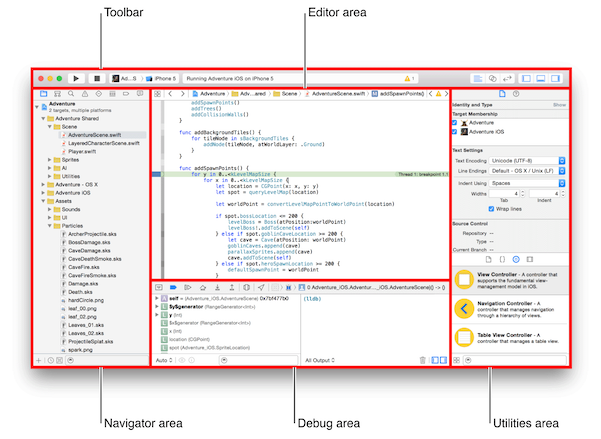
- Editor Area: Shows your project's properties, or the contents of files you select from the Navigator Area.
- In a new project it shows your project's properties.
- Click on main.cpp in the navigator area to see your code in the editor area.
- Click on your project's top level item, with the blue app icon, to see project properties again.
- You can jump to specific functions within a file by clicking on the text or function name at the end of the Jump Bar at the top of the editor window.
- At the end of what looks like a directory path, the Jump Bar will say No Selection
- Click those words to reveal a menu with one item - the main function.
- Click the main function in that menu. Its header will be highlighted, and XCode takes you to it, if it is off the screen.
- The same method can take you any function or function prototype in your program
- Toolbar:
collects important functions.
- By far the most useful ones to
you right now are the Run (Command-R) and Stop (Command-.) buttons to the left. Their purpose should be obvious. The run button will save your files and compile your program for you if necessary.
- Please note the Breakpoints button. It toggles debugging mode. Any time you add a breakpoint to your code, debugging mode will be turned on automatically. You can use the Breakpoints button to disable all breakpoints at once and exit debugging mode.
- Add breakpoints to your code by clicking in the bar to the far left of the editor area.
- Run your code.
- The Debug Area will open at the bottom of the workspace window and show you some debugging controls.
- Note the current running line in the editor area, and the automatic variables to the left of the debug area.
- Stop the program.
- Toggle the Breakpoints button and run again.
- Note your program's output to the right of the debug area. You can click here to type input if required.
- Also note the View buttons to the right. They can show or hide the side and bottom panes.
- Navigator Area: this pane allows
you to explore the various components of your project.
- Initially the folder, or Project Navigator, icon will be selected in the navigator selector bar. This is the navigator you will use most often.
- If you did some debugging you will be in the Debug Navigator.
- You will also use the exclamation mark, or Issue Navigator, icon to debug your program. When you have a compile time error, you can see the list of errors there.
- create an error in main.cpp and Run your program. The error will be highlighted in the Editor.
- You will also see a red exclamation mark in the Toolbar's status window. Click it and your navigator will switch to the issue navigator.
- Fix the issue, test it, and switch back to the project navigator.
- Debug Area:
allows you to interact with console based programs, see log messages and control the debugger.
- You saw the input/output pane when you ran your code earlier.
- Start debugging.
- Note the Debug bar. From left to right are:
- minimize
- continue
- step over
- step in
- step out
- Thread and stack location.
- This is also shown in the Debug Navigator.
- When a program crashes, you don't always end up in a useful function - often it's a library function. Navigate the stack to see what line in your code caused the error.
- You can add an expression to the Auto variables pane by alternate clicking there and selecting Add Expression.
- Utility Area: you will not be using this at all in this class. You can learn about it at your leisure.