2. You can download and install Visual Studio 2019 Community Version for free, make sure you have or applied a valid Microsoft account.
Alex installs Visual Studio 2019 Community VersionVisual C++ comes within Microsoft Visual Studio. Visual Studio also contains Visual Basic, Visual C#, and Visual J#. Using Visual Studio, you can mix and match languages within one "solution". We will, however, focus on developing C++ code throughout these labs.
Visual Studio is a programming environment that contains all the libraries, examples, and documentation needed to create applications for Windows. Instead of talking about programs (as we did in CS110 and CS115), we talk about projects and solutions. Solutions can contain several projects and projects typically contain multiple items or files. For more information about projects, see the MSDN Solution and Project Basics page.
For your first C++ program, you will build a console mode application that displays a greeting message. This (i.e. a console mode application) is the kind of VC++ programs that you will build for all your lab and class exercises/assignments.
Console mode programs are often simpler to build than Windows applications, and this example will take you through the steps of creating, building and executing a program in Visual C++. We first assume that you use the built-in code editor in Visual Studio to edit your code; then we will show you how to build and run your C++ programs that you have created with any external editors.
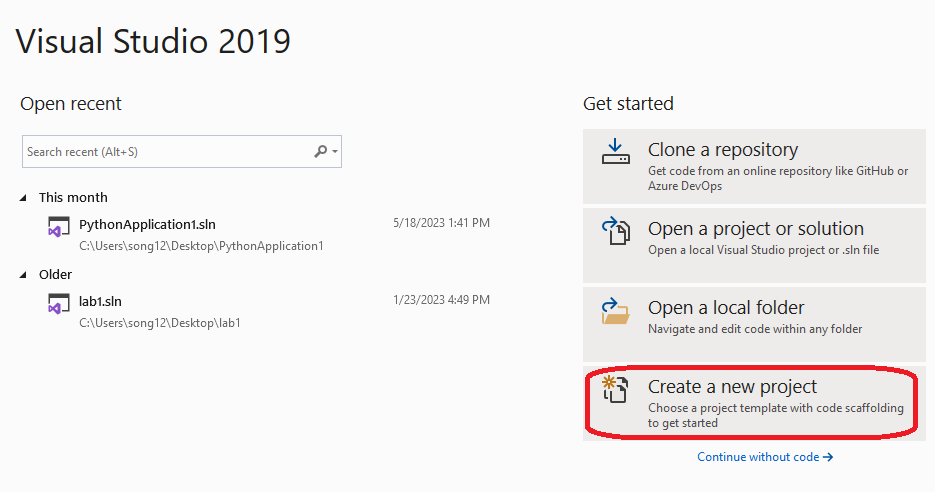
Press Start | All Programs | Microsoft Visual Studio 2019 |
You may also find a shortcut to Visual Studio 2019 on your desktop.
If this is the first time Visual Studio being used, you have to choose Visual C++ Development Settings, then click on Start Visual Studio.
The next thing you will see is the Start Page.
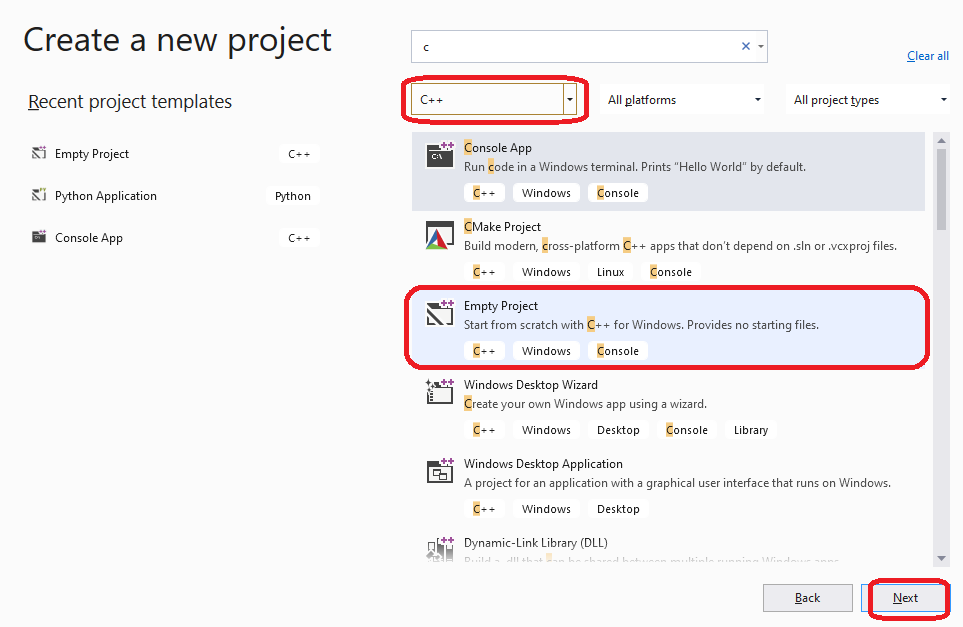
Make sure you are in the C++ platforms.
Choose Empty Project and then click on next.
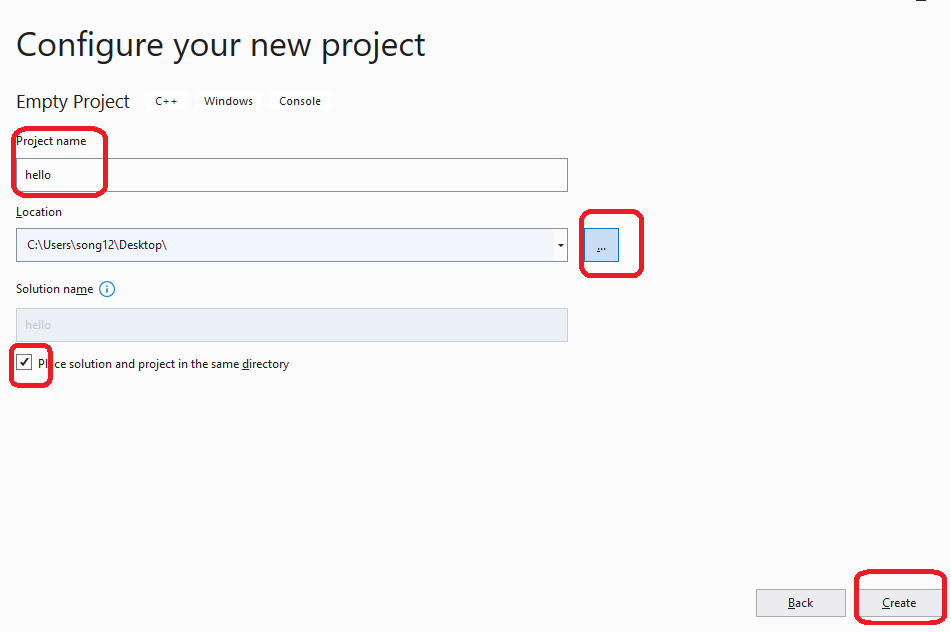 Follow these steps:
You want to add C++ source code to this project.
This file will be added to the hello workspace that we have just created, and a blank document will be opened for editing
Exercise:
Copy the following program in the source code editor:
// FILE:     hello.cpp
// PURPOSE:  An example of a simple I/O stream

#include <iostream>
using namespace std;

int main()
{
	char name[50];
	cout << "Please enter your name:" << endl;

	cin >> name;
	cout << "Hello, " << name << endl;
	return 0;
}
In order to compile any code in Visual C++, you have to create a project. A project holds three major types of information:
1) It remembers all of the source code files that combine together to create one executable. In this simple example, the file hello.cpp will be the only source file, but in larger applications you often break the code up into several different files to make it easier to understand (and also to make it possible for several people to work on it simultaneously). The project maintains a list of the different source files and compiles all of them as necessary each time you want to create a new executable.
2) It remembers compiler and linker options particular to this specific application. For example, it remembers which libraries to link into the executable, whether or not you want to use pre-compiled headers, and so on.
3) It remembers what type of project you wish to build: a console application, a windows application, etc.
If you are familiar with makefiles, then it is easy to think of a project as a machine-generated makefile that has a very easy-to-understand user interface to manipulate it. For now we will create a very simple project file and use it to compile hello.cpp.
Exercise:
A black DOS window will pop up and just follow the instruction to see the output.
Now, we will continue onto the next topic. Choose File | Close Solution This will return you to the Start Page.
The preceding section showed the procedure for creating a C++ program with only one file component, hello.cpp, and we used the built-in VC++ source code editor to edit the file. However, when you are working on a large program, you would break your program into smaller, more manageable parts. In other words, your project would contain more than one C++ source file. You can create each file yourself, just like you did with hello.cpp, or you can add C++ source files from somewhere else.
The following section demonstrates how to create, compile, and execute a VC++ project with more than one file.
Exercise:
It is always a good practice to put the source files in the project folder. Let's do that now.
Right click on these files and save them to your project folder:
Even though the files are in the appropriate directory, you must tell Visual Studio that these files are part of the project.
Like most people, you may find that your programs do not work as you expected the first time you run them. To find out what is wrong, you might use cout statements to follow the line of execution of your code. This works, but later, when things are fixed, you must remember to remove all the extra cout statements.
Visual Studio provides a wonderful debugger for helping you find run-time errors in your code. However, before we get into the details of how to use this debugger, some terminology might be useful. Notice that the keywords below are links to pages (with the sources of this information)
| Syntax Errors |
|
| Semantic Errors |
|
| Logic Errors |
|
| Debugger |
|
| Breakpoints |
|
When your program is stopped at a breakpoint, your program and debugger are said to be in break mode. Visual Studio has four basic types of breakpoints:
Remember that your project must compile and link before you can use the debugger.
As a general overview to debug your project you must:
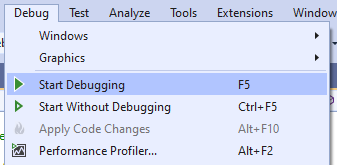
The basic command to start the debugger can be found under Debug | Start Debugging in the main menu.
The Debugger will execute code from the current location until it reaches a breakpoint, the end of the program, or a point at which the program pauses to get input from the user. When the debugger is started, the "Debug" menu changes to have some additional commands which are also displayed on the toolbar. A few of these commands are summarized in the following section.
F9: Toggle breakpoint A breakpoint is any point in the executable code where the execution stops, allowing the programmer to see what is going on inside the program as it runs. Breakpoints allow you to run through portions of the code where there are no problems, so that you can spend your time focusing on the areas that need to be fixed.
Toggling a breakpoint can be done visually. Click on the shaded bar to the left of the line of source code you want to stop on. You may also set a breakpoint by right-clicking the mouse and selecting "Insert/Remove Breakpoint" from the pop-up menu. A red dot will appear in the shaded bar to the left of the line of code to indicate the breakpoint has been set. If you click on the red dot, the breakpoint will be removed and the dot will disappear.
 F11: Step
Into When Step Into is chosen, the debugger executes each C++
statement one by one. Pausing to let the programmer check the values of
variables or make adjustments between statements. Step Into lets the
programmer step into every function call, loop, or other code block in the
program. In essence, no statement will be executed until the programmer is
ready to execute it.
F11: Step
Into When Step Into is chosen, the debugger executes each C++
statement one by one. Pausing to let the programmer check the values of
variables or make adjustments between statements. Step Into lets the
programmer step into every function call, loop, or other code block in the
program. In essence, no statement will be executed until the programmer is
ready to execute it.
 Shift + F11:
Step OutStep Out is used in conjunction with Step
Into. It will immediately execute the remaining code in the current function
call, loop, or other code block, then pause execution. The programmer can
continue to debug the program.
Shift + F11:
Step OutStep Out is used in conjunction with Step
Into. It will immediately execute the remaining code in the current function
call, loop, or other code block, then pause execution. The programmer can
continue to debug the program.
 F10: Step
OverThis command is used to step through a
program without stepping into function calls. When Step Over is used on a
function call, loop, or other code block, the entire block is executed
immediately.
F10: Step
OverThis command is used to step through a
program without stepping into function calls. When Step Over is used on a
function call, loop, or other code block, the entire block is executed
immediately.
The file: debug.cpp
Follow these steps to debug debug.cpp program:
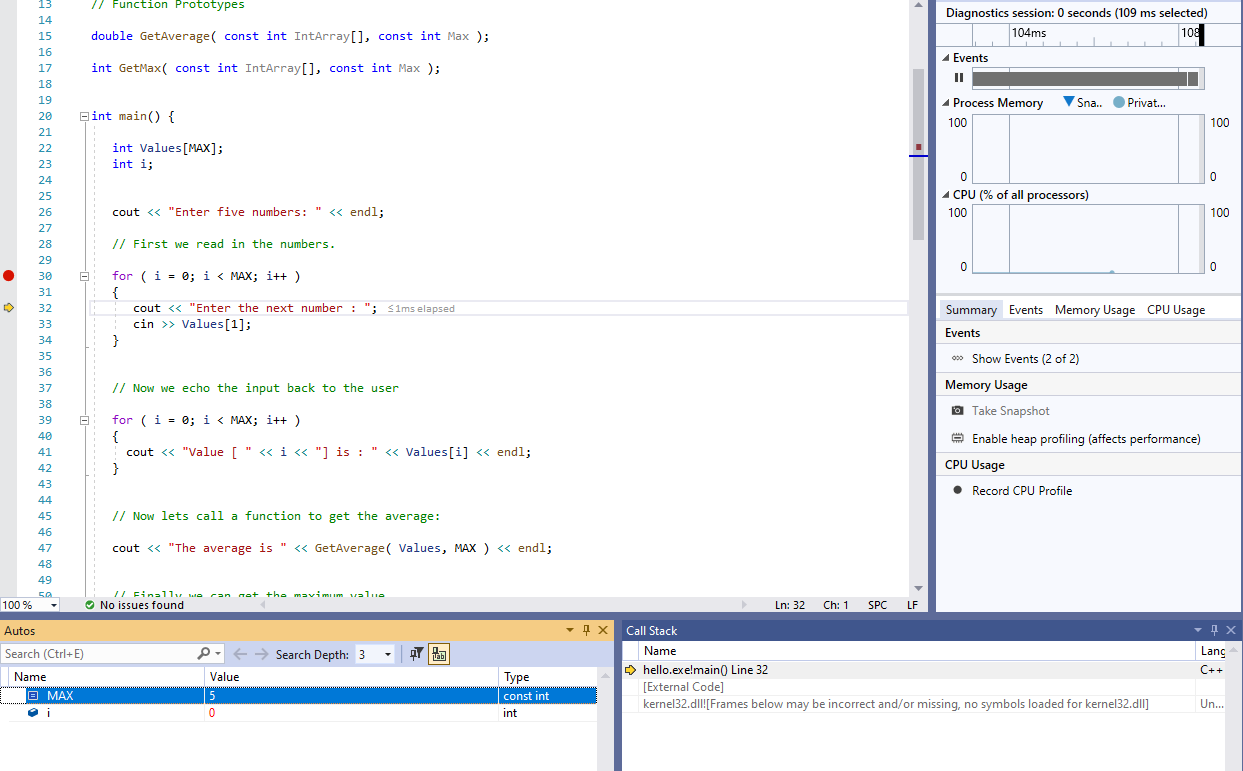
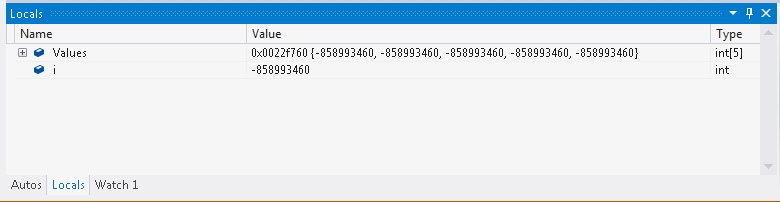
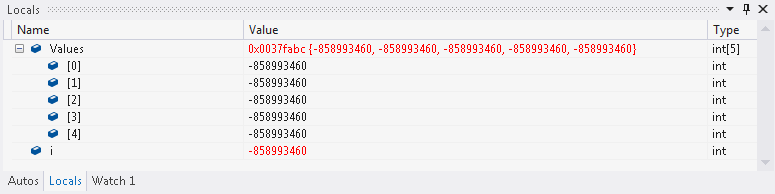
Locals Watch Window: Displays all variables that are in scope at the current location, except for globals. For example, if we stop at a break point right before the first for statement, two variables appear in the locals watch window: Values and i. Although there are more than two variables in the program, these are the two variables that are in the local scope. Other variables may be accessible to the program, but they were defined outside the local scoope. Notice that there is a small plus in a box to the left of the variable Values, and its value looks something like this: 0x0012ff50:
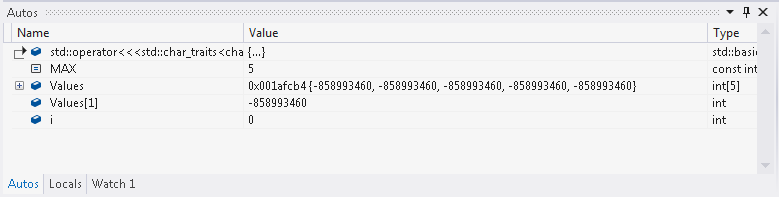
Autos Watch Window: Displays values that are of immediate interest: those that are about to be used, and those that have just been changed (highlighted in red). It also shows functions that returned. For example, debug again and click the Autos tab. Only two values appear in the immediate watch window: MAX and i. Although there are more than two variables in the program, these are the two variables that are of immediate interest; both are about to be used by the for statement.
Press F10. The value of i should change to 0, and it becomes red to show you that it changed.
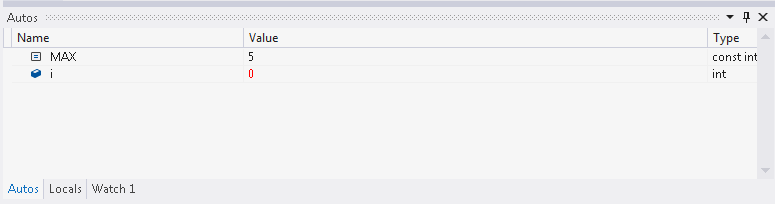
Press F10 again. You will now see a return from a << operator (from the cout statement that just finished, as well as MAX and i because they are about to be used by the for statement, and you see other values related to the cin that's about to happen.
Watch 1 Window: This watch window becomes useful when you would like to watch a variable in your program at all times, regardless if it is being watched by the locals window or not. To watch a variable (or an expression) in this window, simply select a variable from the locals watch window and "drag" it into the Watch Window, or type the name of the variable or expression that you would like to watch in the Watch Window. In our example, we would like to watch i and Values at all times, (since the values of Values are not printed out correctly on the screen when we run the program in step 2)), so we drag these two variables into this watch window.
(Before we do this, we may have to undock "Watch 1" by double clicking on the tab)When debugging and using the watch windows you may be able to see some parts of an array, class or structure as you can in the values in an array. What if the information is too big, how would you show all of it?
The 0x indicates that it is a hexadecimal value. Since Values is an array of integers, the value being displayed is the memory location where the array begins. Click on the plus sign on the left of the variable name. The array expands below the name, showing the indices of the array and the values for each of the integers in the array. The plus sign has also become a minus sign. Click on the minus sign to hide the array.
Step through the code. VC++ programming environment allows you to step through the code in two different ways. You can a) execute one line at a time, stepping into each function call, or b) run the function without tracing what is going on inside the function. We will look at examples of the first.
Right now, the execution of your program halts after the
first cout statement is executed, because we set a
breakpoint there. This is indicated by a yellow arrow inside the red
dot:  . Let's step into the loop and see what happens.
On the Tool bar are three important icons to use with the debugger. One
shows a blue arrow jumping over some lines of code (Step Over F10) . Another shows the arrow
pointing into the braces (Step Into F11) . These are the buttons for single stepping through a
program. There is also, the Step Out button, which allows you to skip large
blocks of code in debugging. Let's use the Step Over Button first.
Press the Step Over button . The yellow arrow will move to the next line. Keep pressing
the Step Over button until the the console window pops into the forground
asking you for input:
At this point, the program is expecting some input from the user. Enter the number 5 as input and hit return.
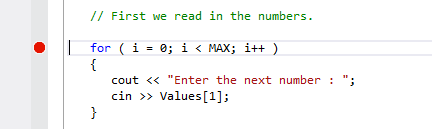
Now click on the plus sign to the left of the variable Values in the Watch Window to expand that variable. We notice that something is wrong here: the first number we entered just now should be assigned to Values[0], but instead, it is assigned to Values[1]:
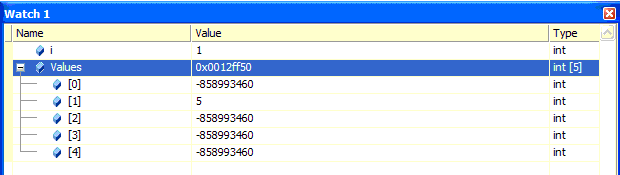
Examine the code in the source code window, and you will find
that inside the first loop block, the statement
cin >> Values[1];
should read: cin >> Values[i];;
otherwise, all the keyboard input will go to Values[1].
Change this line of code; recompile and rerun the program and it
should work properly.
We leave it to you to explore other features of the VC++ debugging utility.
In this lab example, we used the Step Over to examine the loop. What will happen if we use Step In? Well, Step In will examine the program one line a time and it will go into every function if a function is called. Therefore, if we use Step In to examine the loop with the cout and cin statements, we would have stepped into the cout and cin system functions. this is not what we want. So when you debug your program, whenever you encounter the system functions, which do not need to be debugged, use Step Over instead of Step In.
This is one of the tricky part of the debugging process which could get you into trouble. You will get into even more troubles if you do not know what you are doing. The following are some surprises, how they happened, and how to deal with them.
when you should have pressed over , and you
entered some function you didn't expect (such as a predefined
library function). This might happen especially if you press Step
Into when
the arrow points to an input or output statement (the
<< and >> operators are actually
predefined functions). (It can also happen if you press Step Over beyond
the point where your program ends.) VC++ is asking for a file
containing the source code for this function. Select
Debug | Step Out)
to finish executing the library function and get execution
back to your source code. (should have used ). This is the assembly code version of the function. Select
File | Close to get back to your source code window, then
press to finish
executing the library function and get execution back to your source
code. If all else fails, you can always select Debug | Restart to start your program over again, or select Debug | Stop Debugging to quit execution of your program and stop debugging altogether.